
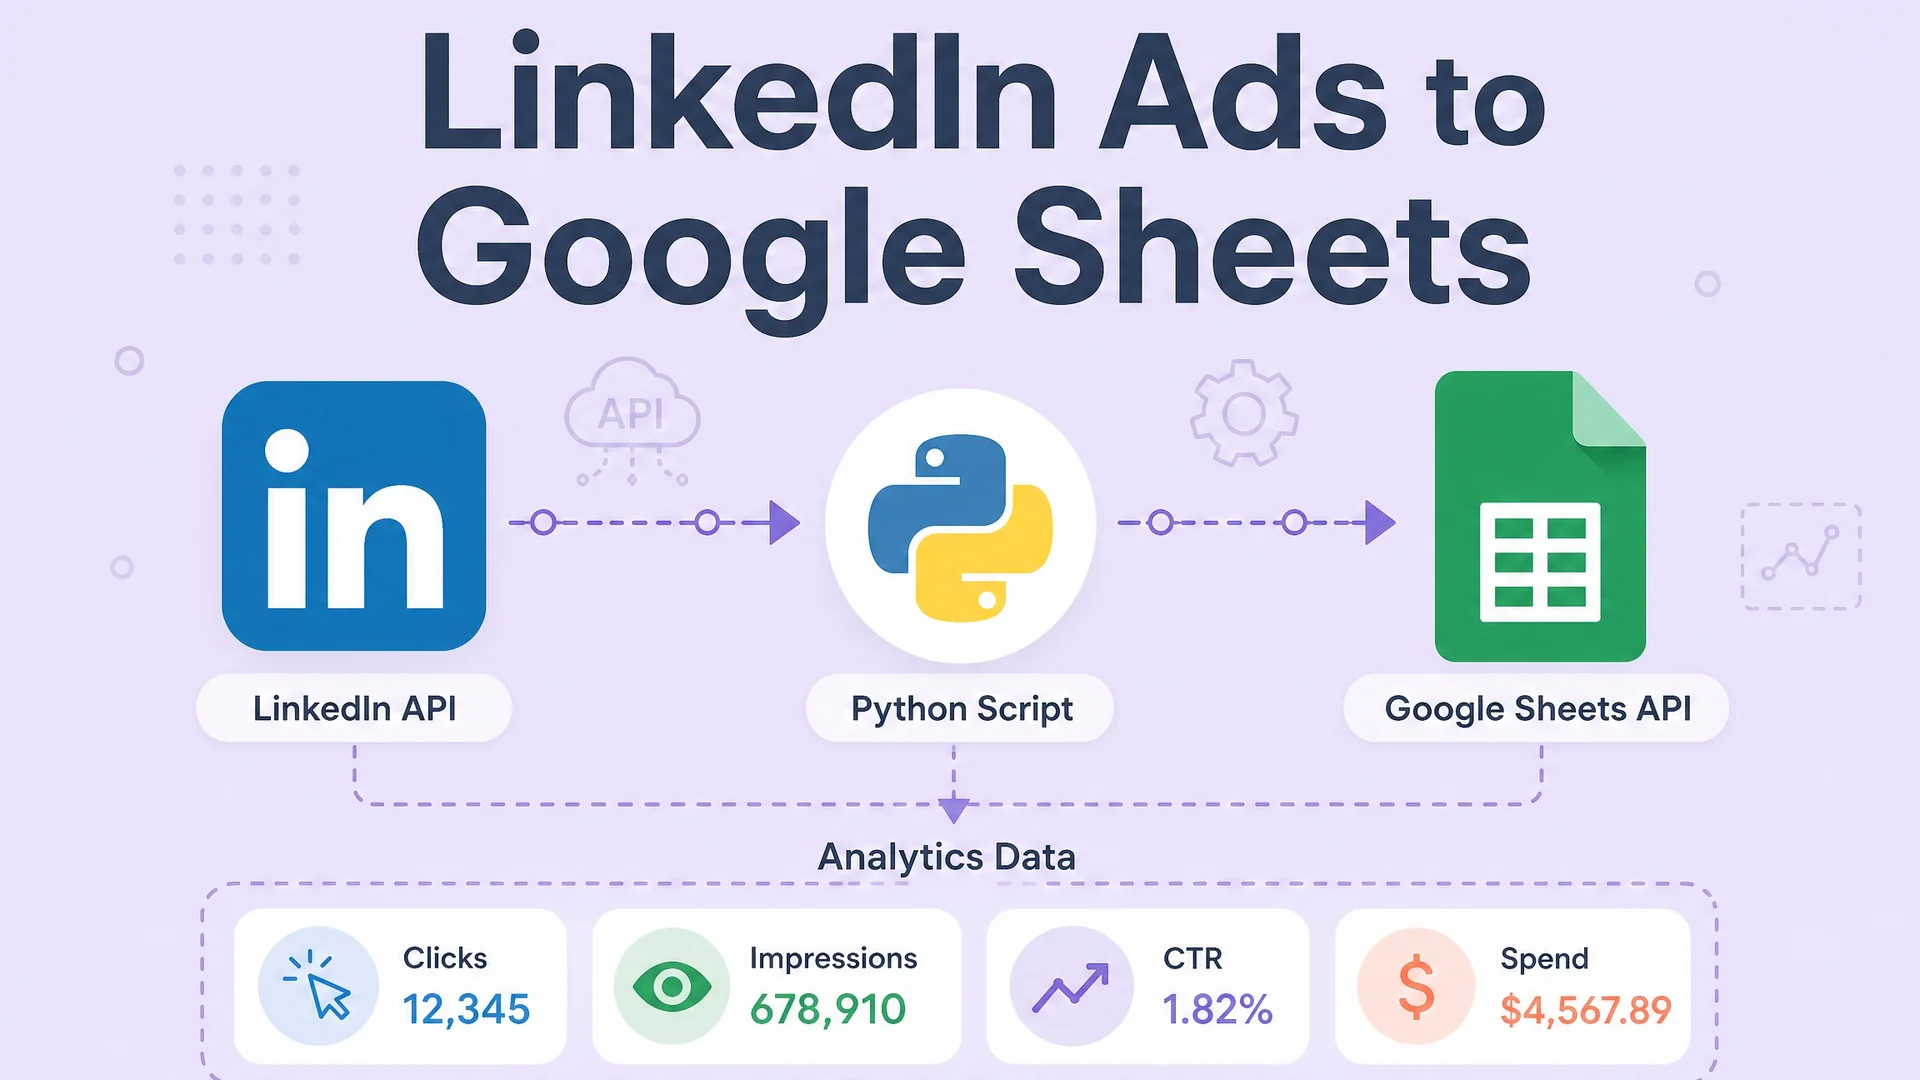
If you run LinkedIn Ads yourself, you already know one of the most hated jobs. Open Campaign Manager, export a CSV, download it, open it, paste it into a sheet.
Then do it again for the next campaign and the next date range.
This script automates LinkedIn Ad Analytics straight into Google Sheets. Instead of copy-pasting, all you have to do is run the script and let it handle the rest.
This post is exactly that, built for LinkedIn.
A short Python script that pulls the last 90 days of your daily campaign data straight from LinkedIn's API and writes it into Google Sheets on its own.
All without any copy-paste, CSV, or rebuilding a pivot table every Monday.
Do This Before You Touch Any Code
If you've never opened Google Cloud Console, it's the control panel for your Google account's projects, API access, and billing. Everything that follows happens inside it.
Most people skip this step because they assume opening Cloud Console means handing over a credit card.
It doesn't. Google's Sheets API is free up to 300 read or write requests per minute per project, and 60 per minute per user. Running this for one LinkedIn account will not cost you anything.
Also, this isn't Apps Script, it's a Python script hitting Google's Cloud APIs directly, but the same rule applies either way. You're not paying for this.
You can run the script anywhere that runs Python.
Google Colab is the easiest option if you don't want to install anything. Because it's free and runs in the browser.
JupyterLab or a local Python install both work the same way. Pick whichever one you already have.
How To Get Google Sheets To Accept The Data
Create a new project in Google Cloud Console, then enable the Google Sheets API and the Google Drive API for it.
Next, create credentials. For a script that runs on a schedule with nobody there to log in, use what Google calls a Service Account, which is basically a login built for a robot instead of a person.
A normal Google login expects a human to sit there and click "allow" on a permissions screen. A Service Account skips that. Approve it once, and after that it can run in the background and write your data into the sheet even while you're asleep without you touching anything.
Once the Service Account exists, download its JSON credentials file, a small text file with a digital key inside it. That key is what lets your Python script prove to Google it's allowed to open and edit your spreadsheet.
Treat that file like a password. Don't upload it anywhere public, like a shared GitHub project, where anyone else could grab it and use it to access your Sheet.
Why Not Just Use Supermetrics?
Why would you use this instead of something like Supermetrics?
Well, it's free. While paying for convenience is real, you are always limited by the tool's own capabilities and whatever their development team would add in as a feature.
Learning to work with the APIs basically helps you circumvent limitations of the tool, and running scripts on Google Colab or Sheets or locally saves you tons of money in tool costs or even credits that Supermetrics or any other tool charges based on rows fetched or calls.
The Python Script To Automate The Manual Task
Now, there’s something you want to know: the script first grabs your campaign names from LinkedIn, so your report shows readable names instead of ID numbers. It reads the first page of them, so an account carrying more campaigns than that first page holds will show Unknown Campaign on the rest.
Then it goes day by day through the last 90 days and pulls three numbers for each campaign based on:
How many people clicked, how many times the ad was shown, and how much you spent.
Now, here’s the Python Script to automate the manual task:
Install what it imports before you run it: pip install gspread google-auth requests.
import requests
from datetime import datetime, timedelta
import gspread
from google.oauth2.service_account import Credentials

# Google Sheets setup
scope = [
    "https://www.googleapis.com/auth/spreadsheets",
    "https://www.googleapis.com/auth/drive",
]
creds = Credentials.from_service_account_file("path_to_credentials.json", scopes=scope)
client = gspread.authorize(creds)

# Open your Google Sheet
spreadsheet = client.open("LinkedIn Analytics Data")  # change to your sheet name
sheet = spreadsheet.sheet1

# Clear the sheet before writing new data
sheet.clear()

# LinkedIn setup
ACCOUNT_ID = "YOUR_ACCOUNT_ID"  # numeric ID from Campaign Manager
ACCESS_TOKEN = "YOUR_LINKEDIN_ACCESS_TOKEN"
ACCOUNT_URN = f"urn%3Ali%3AsponsoredAccount%3A{ACCOUNT_ID}"

headers = {
    "Authorization": f"Bearer {ACCESS_TOKEN}",
    "LinkedIn-Version": "202604",
    "X-Restli-Protocol-Version": "2.0.0",
}

# Fetch campaign names so we can label each row
campaigns_url = f"https://api.linkedin.com/rest/adAccounts/{ACCOUNT_ID}/adCampaigns?q=search"
response = requests.get(campaigns_url, headers=headers)
campaign_id_to_name = {}

if response.status_code == 200:
    for campaign in response.json().get("elements", []):
        campaign_id = str(campaign.get("id"))
        campaign_id_to_name[campaign_id] = campaign.get("name", "Unknown Campaign")
else:
    print(f"Failed to fetch campaigns. Status: {response.status_code}, {response.text}")

# Fetch the last 90 days of daily campaign analytics
all_data = []
today = datetime.today()

for i in range(90):
    day = today - timedelta(days=i)
    date_str = day.strftime("%Y-%m-%d")

    analytics_url = (
        "https://api.linkedin.com/rest/adAnalytics?q=analytics"
        f"&dateRange=(start:(year:{day.year},month:{day.month},day:{day.day}),end:(year:{day.year},month:{day.month},day:{day.day}))"
        "&timeGranularity=DAILY&pivot=CAMPAIGN"
        f"&accounts=List({ACCOUNT_URN})"
        "&fields=clicks,costInLocalCurrency,impressions,pivotValues"
    )

    response = requests.get(analytics_url, headers=headers)

    if response.status_code == 200:
        for row in response.json().get("elements", []):
            clicks = row.get("clicks", 0)
            impressions = row.get("impressions", 0)

            # LinkedIn returns money fields as strings, not numbers
            try:
                cost = float(row.get("costInLocalCurrency") or 0)
            except (TypeError, ValueError):
                cost = 0.0

            campaign_id = row.get("pivotValues", [""])[0].split(":")[-1]
            campaign_name = campaign_id_to_name.get(campaign_id, "Unknown Campaign")

            all_data.append({
                "Date": date_str,
                "Campaign": campaign_name,
                "Clicks": clicks,
                "Impressions": impressions,
                "Cost": f"{cost:.2f}",
            })
    else:
        print(f"Failed to fetch analytics for {date_str}. Status: {response.status_code}, {response.text}")

# Write everything to Google Sheets
sheet.append_row(["Date", "Campaign", "Clicks", "Impressions", "Cost"])

for entry in all_data:
    sheet.append_row([entry["Date"], entry["Campaign"], entry["Clicks"], entry["Impressions"], entry["Cost"]])

print("Data successfully dumped into Google Sheets!")
Keep These 2 Things In Mind BEFORE You Run This
FIRST: ACCESS_TOKEN expires. LinkedIn resets it roughly every 60 days, and when it dies, the script doesn't throw a dramatic error. It just prints Failed to fetch analytics next to every single day and moves on.
Here's the part worth knowing, though: the script clears your sheet before it writes anything back, and it does that before it ever checks whether the token still works.
So an expired token doesn't leave you with a sheet that quietly stops updating and still looks fine. It leaves you with an empty sheet, just the header row, because the wipe happens no matter what.
It's not exactly subtle once you notice it, but if you're not the one watching it run, it can sit that way for a while.
SECOND: sheet.append_row() gets called once for every row it writes, and each of those calls is one write request against the Sheets API. Google allows 60 write requests per minute per user, and your service account is that user.
Run the numbers on a single campaign: 90 days plus the header row is 91 requests, fired within about thirty seconds. You are already over. Around request 61 Sheets returns a 429, there is no retry anywhere in this script, and it dies with the sheet holding the header and whatever rows made it through. The clear happens first, so last week's data is gone too.
So campaign count is not what protects you here. One campaign trips it. Five campaigns is 451 requests.
I didn't build a fix for that into this version. It's a small one: the script already collects every row into all_data before it writes anything, so replace the append loop with a single append_rows() call. Sheets counts a batch as one write request no matter how many rows are inside it, so 91 requests become 1.
What To Do When You Run It On A Schedule
Run the script once by hand first, to confirm your credentials and account ID are right. After that, hand it off to a scheduler so it runs on its own.
On a local machine, that's cron, a built-in tool that runs a command automatically at times you set.
On Colab, you can use its own built-in scheduling instead. Daily is usually overkill for LinkedIn Ads. Weekly catches most reporting needs without wasting API calls.
Once this is set up, the only thing that changes about your Monday is what you do with the time you get back.
Sprout Social's survey of 500-plus marketers put data analysis and reporting at close to 4 hours a week on average. Most of those 4 hours isn't analysis. It's the exporting, the pasting, and the reformatting before the analysis even starts.
This script won't do your analysis for you. It just clears out the 4 hours of clicking so you can get to it faster.

Written by
Dan Antony
I have spent 11 years building marketing teams and infrastructure from scratch — from a $1.5M B2B SaaS budget to leading two brands across India and Singapore. I write about Meta Ads, Google Ads, SEO, and the MarTech stack that actually moves the needle.